您好,欢迎来到显微镜配件耗材官网!
 最新资讯返回
近十年来超分辨荧光成像可以说是生物物理领域最热门的研究方向,尤其是基于单分子定位的超分辨荧光成像技术1,2,3,它为细胞生物学的研究提供了新的技术手段,高精度的单分子定位图像能帮助研究者观察到许多以前看不到的精细结构,该技术面世不到十年即获得了诺贝奖。冷冻电镜技术近几年来也是发展的如火如荼,为细胞生物学和结构生物学注入了新的活力。
单分子定位荧光成像具有特异性标记、精确分子定位的优势,电镜具有超高分辨率、解析细胞内部细节结构优势。这两种技术的结合衍生出来的超分辨光电融合成像技术(Correlative lightand electron microscopy, CLEM)给生物成像技术带来了新的发展契机,该技术通过把定位位置信息和结构信息进行整合、处理,可以表征出目标分子机器在细胞原位的分布、结构。2006年Betzig等人在Science发表的首篇PALM技术的文章1中就把单分子定位荧光成像与透射电镜的成像进行了结合,以验证PALM技术的可靠性。2010年Watanabe等人在普通切片上实现了PALM与扫描电镜的结合4。这些工作代表着超分辨光电融合成像技术发展的起始,也预示了光电融合技术的两个发展方向:一个方向是向超微观方向发展,旨在原位观察分子机器结构,并阐述其功能;另外一个方向是向宏观方向发展,发展厚样本的光电融合观察方法,在整个细胞或生物个体水平上观察分子机器的定位和分布,绘制生物分子分布的地图。
相比常温样品的光电融合成像,冷冻样品的光电融合成像更具优势:(1)低温下荧光分子发光性能提高,成像定位精度也大幅度提高;(2)冷冻样品制备方法能保持样品的近天然状态。由于冷冻条件下光敏荧光分子发光的特性还有待研究,而且冷冻超分辨成像的冷台要满足防空气里水份污染、防止激光照射下样品升温、液氮制冷环境下保持稳定性、便捷的样品转移等苛刻条件,因此尽管该技术具有诸多优势,目前的文献报道还很少。FEI和Leica公司都推出了普通荧光成像的冷台,但目前市场上还没有专用于超分辨成像的商业化冷台。
冷冻超分辨光电融合成像的应用主要有两个方面:
(1)利用单分子定位成像的精确定位信息引导冷冻电镜数据的收集,因为高分辨冷冻电镜成像区域在1μm以内,很难发现感兴趣的目标,光镜信息则可以快速引导电镜数据的收集,代表性的工作是加州理工Grant Jensen实验室在2014年发表在Nature Methods上的工作5,他们在Myxococcusxanthus (革兰氏阴性杆状细菌)里利用cryo-PALM定位PA-GFP标记的第六分泌系统,并在cryo-PALM得到的定位信息的指引下用冷冻电子断层成像(cryo-ET)研究其构象(Fig 1)。由于某些原因该工作只发现了PA-GFP这一种能在低温下进行光转换的荧光蛋白,而且成像定位精度也较低。
(2)研究特定的生物分子在亚细胞结构里的精确定位和分布,代表性的工作是中科院生物物理所徐涛研究员和纪伟等人发展的csCLEM(cryogenicsuper-resolution correlative light and electron microscopy)技术6, 在2015年发表的ScientificReports文章上,该技术验证了TOM20蛋白分子在线粒体膜上的精确定位分布,这也是第一篇把冷冻超分辨光电融合成像技术应用于哺乳动物细胞,并首次实现了三维的冷冻超分辨光电融合成像(Fig 2, Fig 3)。在这个工作里还发现了更多的能用于低温荧光成像的光敏荧光蛋白,它们在低温下所发的光子数比常温下多出数十倍,把成像定位精度提高到10 nm以内。
期待这个新兴的技术能给大家带来越来越多的惊喜。
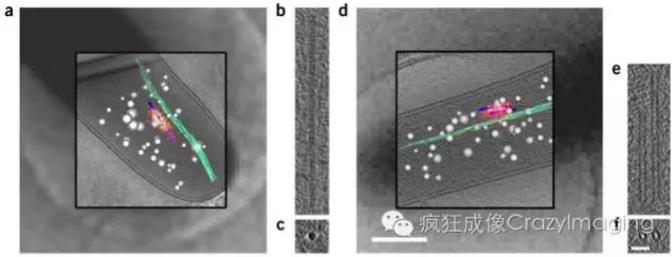
Fig1.Correlated cryo-PALM-CET used to visualize extended and contractedconformations of the T6SS sheath in M. xanthus. (a,d) Low-resolution EM images(grayscale background), cryo-PALM images (red and yellow foreground), slicesfrom high-resolution three-dimensional cryo-tomograms (grayscale foreground),and segmentations of cellular structures (blue, tubular structures; green,filament bundles; white, spherical granules) superposed. The cryo-PALM imagesreveal VipA–PA-GFP localization (red, low precision; yellow, high precision),identifying the tubular structures asT6SSs. (b,e) Tomographic slices through the tubular structures (blue) in a,dshowing extended and contracted T6SS sheaths, respectively. (c,f)Cross-sectional views of b and e, respectively. Scale bars, 400 nm (d; appliesto a,d) and 50 nm (f; applies to b,c,e,f).
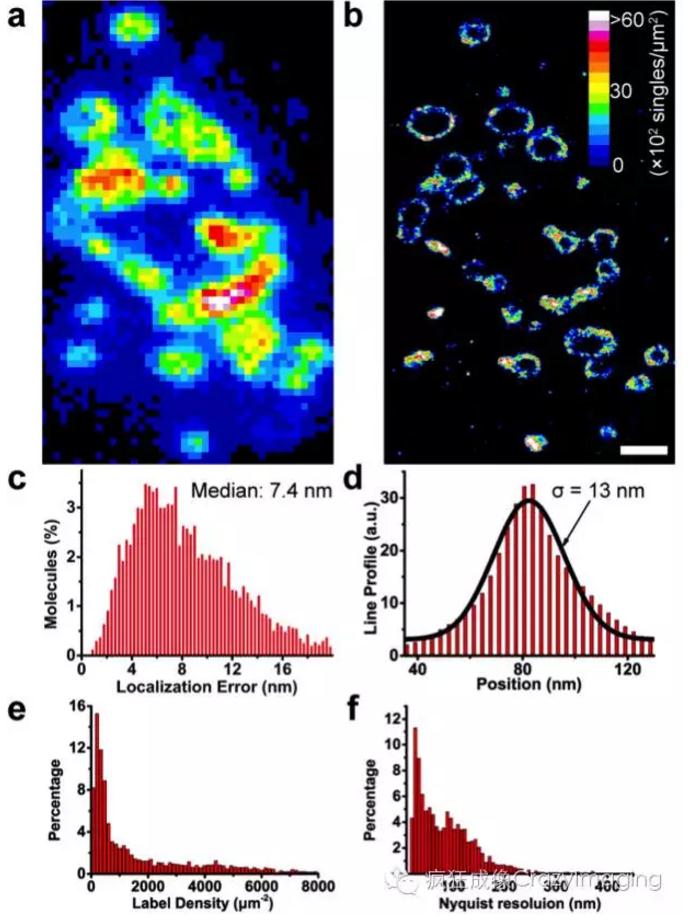
Fig 2.Verification of cryo-nanoscopy’s resolvingcapability. (a, b) Conventional fluorescence image (a) and PALM image (b) of a200 nm cryo-section of a TOM20-Dronpa-labeled HEK293 cell. Scale bar, 1 µm. (c)Distribution of the localization error in the middle layer of z-sectionsobtained from 3D data in b. (d) Line profile of the position marked in b (red).The middle layer was used to generate the line profile. (e) Distribution of labeldensity in b, 1850/744 µm-2 (mean/median). (f) Distribution of Nyquistresolution calculated from the label density in e, 46/74 nm (mean/median).
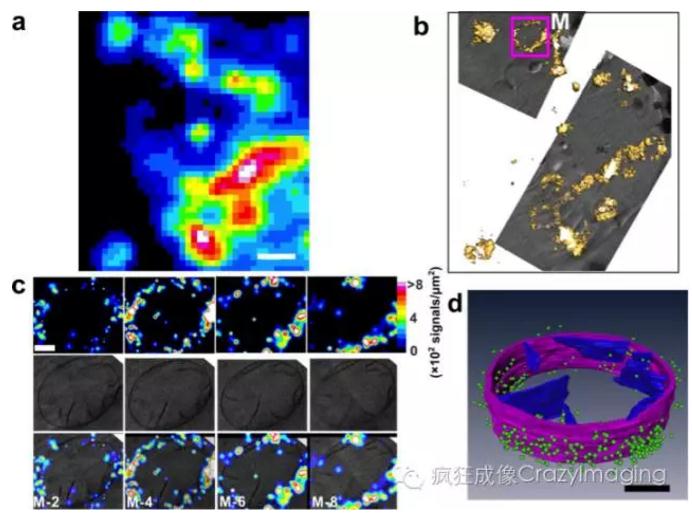
Fig 3. 3D correlativeimages from cryo-sections of HEK293 cells expressing TOM20-Dronpa. (a) Summedimage from single-molecule data. Scale bar, 1 µm. (b) Correlative isosurfacereconstruction of a PALM image with low magnification TEM data. (c) Each columnin c was from a single layer of 3D PALM (top), single layer of cryo-ET (middle)and correlative representations (bottom), respectively. The structuralresolution of the whole 3D data set was estimated to be 73.7 ± 5 nmemploying the Fourier ring correlation method31,32, corresponding to a densityof 749 signals/µm2. Scale bar, 200 nm. (d) Correlative 3D segmentation of cryo-ETdata with single-molecule localization of fluorescent proteins. Mitochondrialouter membrane and cristae are denoted by purple and blue, respectively. Dronpamolecules are denoted by green dots. For clear demonstration, we kept thosesignals that have higher localization precision (2.9/3.0 nm, mean/median),which rejects 90% of the signals. Scale bar, 200 nm.
Reference:
1. Betzig E, et al.(2006) Imaging intracellular fluorescent proteins at nanometer resolution.Science313:1642–1645.
2. Rust MJ, Bates M,Zhuang X (2006) Sub-diffraction-limit imaging by stochastic opticalreconstruction microscopy (STORM). Nat Methods 3:793–795.
3. Hess ST, GirirajanTP, Mason MD (2006) Ultra-high resolution imaging by fluorescencephotoactivation localization microscopy. Biophys J 91:4258–4272.
4. Watanabe, S. et al.Protein localization in electron micrographs using fluorescence nanoscopy.Nat.Methods 8, 80-84 (2011).
5. Chang, Y.-W. et al.Correlated cryogenic photoactivated localization microscopy and cryo-electrontomography. Nat. Methods 11, 737-739 (2014).
6. Bei Liu, YanhongXue, Wei Zhao, Yan Chen, Chunyan Fan, Lusheng Gu, Yongdeng Zhang, Xiang Zhang,Lei Sun, Xiaojun Huang, Wei Ding, Fei Sun,Wei Ji and Tao Xu, Three-dimensionalsuper-resolution protein localization correlated with vitrified cellularcontext. Scientific Reports, 2015, doi:10.1038/srep13017
 QQ 501747125,QQ 3318510886网站建设:合优 网易企业邮箱

 名企招聘
名企招聘